SOVEREIGN RESEARCH · DEEP DIVE
AI Networking: The Economics of Time Saved
By Pavel Sovereign ·
Historical author publication. Original date and analysis preserved; this is not a new Research OS judgment.
Tests how network performance translates into useful work, and how much of that value suppliers retain.
AI Infrastructure Deep Dive | Pavel Sovereign | Sovereign Research
AI Infrastructure Intelligence for Investors. Researching the capital cycle behind AI — from chips to power. Research cutoff: 11 September 2026. Prices: 10 September U.S. close.
1. Thesis
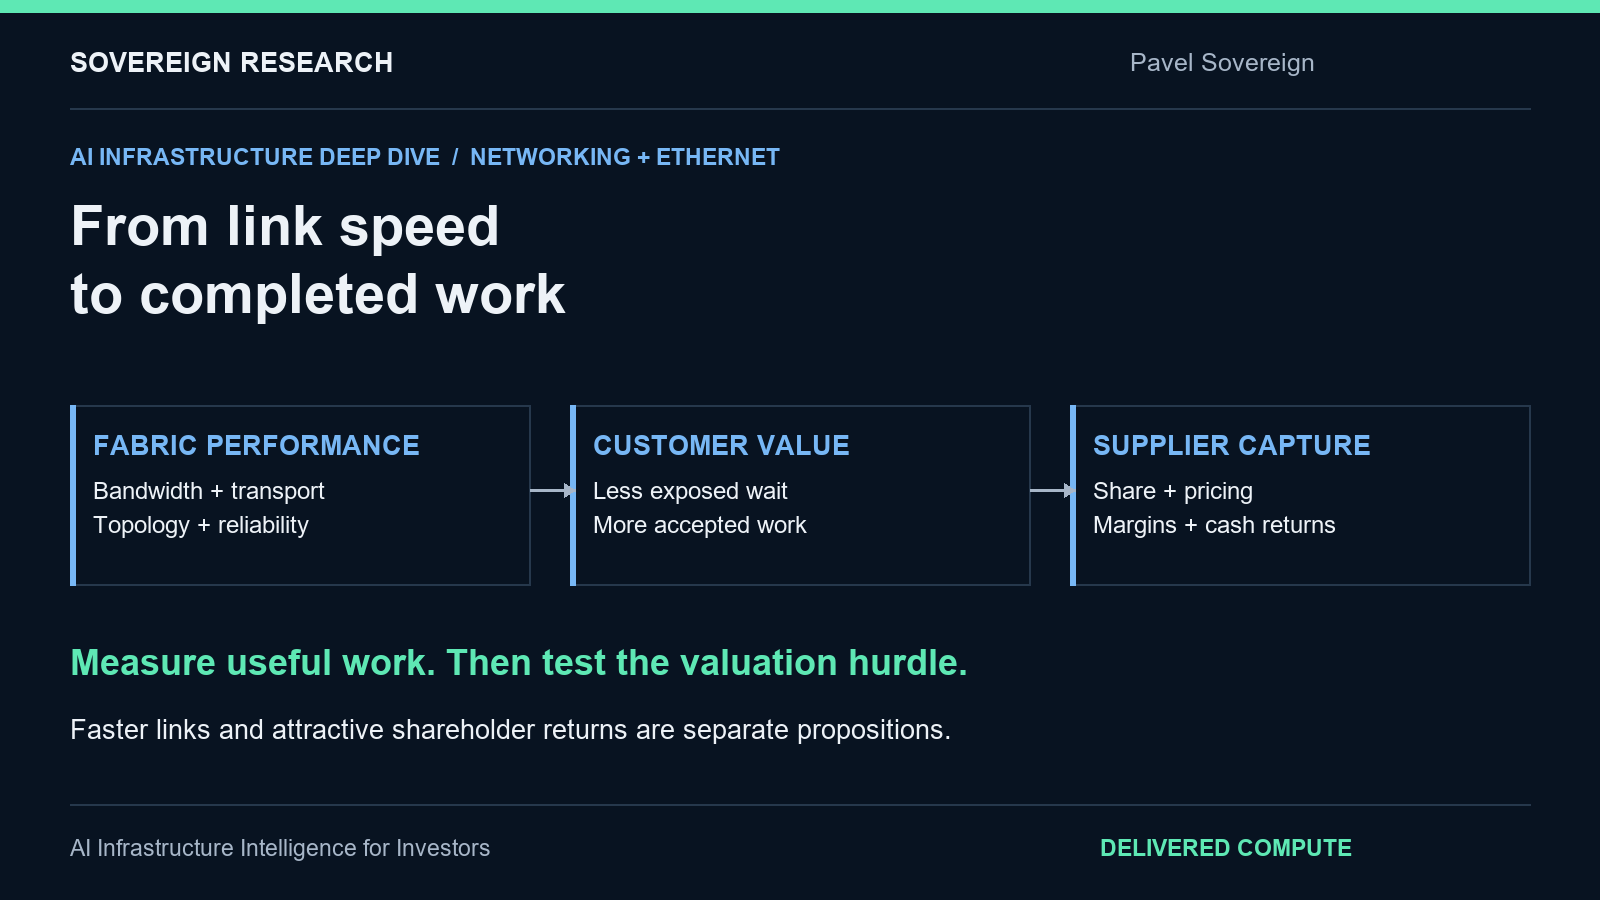
AI networking creates economic value by reducing exposed communication time and avoiding wasted accelerator hours, but faster links do not guarantee proportional workload gains or durable supplier pricing power.
The distinction is essential as network equipment becomes part of the AI investment debate. Port speed measures a component. Job completion measures the system. A supplier’s revenue measures its share of spending. None is a substitute for the other two.
Our working hypothesis is that reliable fabric performance becomes more valuable as customers assemble expensive accelerators into larger coordinated systems. The investor question is who captures the improvement: the equipment vendor, the semiconductor supplier, the cloud operator or the end user through lower service prices.
Arista provides a useful financial and product reference, not the definition of the industry. The relevant object is the network’s contribution to Delivered Compute under a specified workload, power budget and service requirement. A stronger industry can still produce a disappointing equity return if the entry price requires more sustained earnings growth than the supplier delivers.
2. Why This Matters Now
Verified facts: Arista reported Q2 2026 revenue of $3.036 billion, up 37.7% year over year, and non-GAAP EPS of $1.02. It guided Q3 revenue to approximately $3.3 billion and non-GAAP EPS to $1.06–$1.08. The reported Q2 non-GAAP operating margin was 49.9%; the comparable Q3 outlook was 48%–49%. These are consolidated results, not a pure AI networking segment. Arista Q2 results
The operating baseline is already strong. The market question is therefore not whether networking demand exists. It is whether future workload requirements support enough profitable growth to justify the price paid today.
Product timing also matters. Arista’s June announcement described the 7060XE7 platform and a staged availability schedule: the air-cooled 64-port 1.6T configuration in Q4 2026, with specified liquid-cooled and 800G configurations in Q1 2027. These are vendor plans, not proof of accepted production deployments at the research cutoff. Arista 7060XE7 announcement
The variable to follow is the transition from announced capability to operational fabric, then to measurable customer benefit. A future product specification should not be counted as this quarter’s installed performance.
3. System Role
A cluster needs accelerators to exchange information, receive data and coordinate work. Communication that cannot be overlapped with computation extends the time required to complete the job. Delays can also create idle time elsewhere in the system.
Networking sits between installed equipment and effective collective performance. That makes it economically different from simply adding another accelerator. Better communication can increase the useful output of equipment already purchased, provided the workload was actually communication-constrained.
The network is a system of switching, interfaces, transport behavior, topology, links and operations. Optical links are one physical transmission choice within that system. A faster switch does not remove a limitation in the interface, an overloaded path or an application that generates poorly balanced traffic.
The Ultra Ethernet Consortium’s published work addresses congestion control and collective communication as system problems. Its documentation is technical evidence of the functions a fabric must manage; it is not a benchmark proving that one vendor wins every workload. UEC technical white paper
For investment analysis, the right boundary is the complete job or service. Record the workload, cluster size, topology, reliability and power assumptions. Without those definitions, an impressive bandwidth comparison can be economically meaningless.
4. Demand Drivers
Demand depends on more than accelerator count. The communication pattern determines how much data must move, when it must arrive and whether other useful work can proceed while it moves. A fabric designed for one traffic pattern may not deliver the same benefit on another.
Scale matters because more participants can create more coordination requirements, but the relationship is not automatically linear. Software partitioning, model architecture and placement change which devices communicate. Better locality can reduce traffic even while total useful computation grows.
Inference introduces another distinction. An operator may optimize throughput, latency or a service-level target. More requests per second can be valuable, yet unacceptable tail latency can make that apparent capacity unusable for the intended service. Training completion time and inference service capacity therefore need separate measurement.
Replacement demand can also differ from expansion demand. A faster generation may allow fewer devices or fewer network stages for the same task. That can improve customer economics while moderating the number of boxes required. Equipment revenue cannot be inferred by multiplying every accelerator by a permanently fixed networking bill.
The durable demand driver is the value of eliminating an actual coordination constraint. The weak demand argument is that every future accelerator necessarily requires the same increase in network spending, independent of architecture, topology or cost per unit of useful work.
5. Supply / Bottlenecks
The bottleneck can move across layers. More switching capacity does little if the endpoint cannot send efficiently. More physical bandwidth may disappoint if congestion causes uneven completion. A topology can have ample aggregate capacity while a particular traffic pattern overloads the paths that matter.
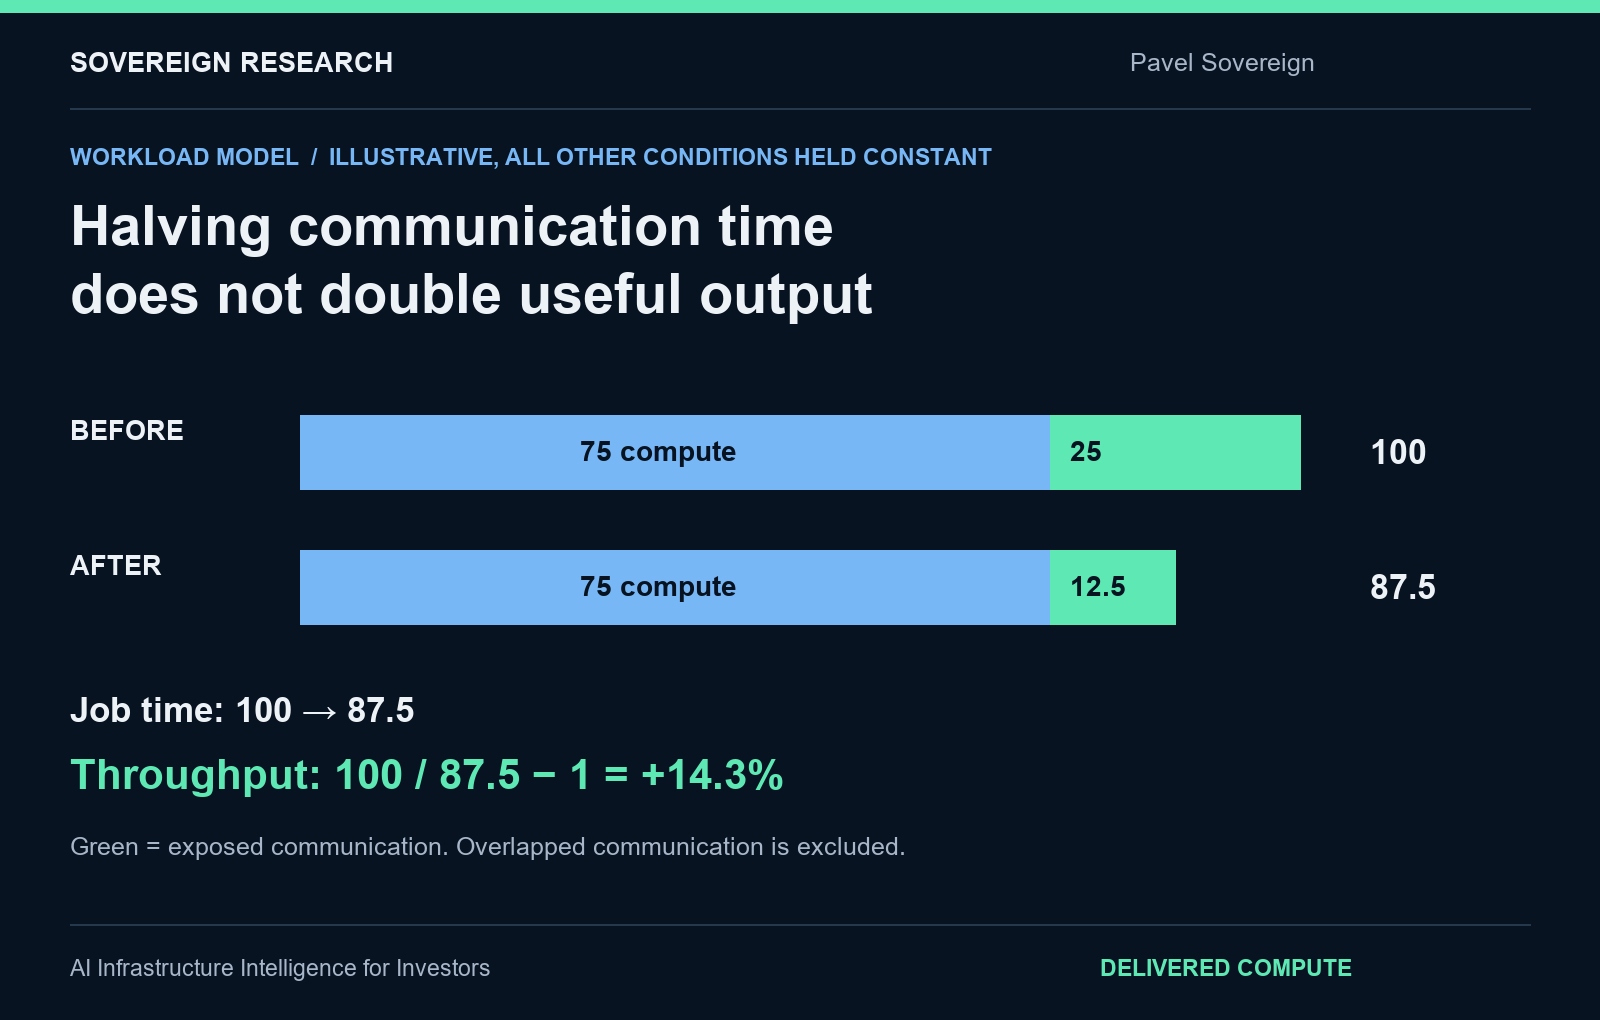
An illustrative workload shows the limit of component extrapolation. Suppose a job takes 100 time units: 75 units of useful computation and 25 units of exposed communication. Assume the communication component is halved, with every other condition unchanged. Job time falls to 87.5 units. Throughput rises by 100 divided by 87.5, or 14.3%.
The communication component improved twofold; completed work per unit of time did not. If communication were only five units of the original job, the same improvement would produce a much smaller system benefit. These are hypothetical sensitivities, not measured Arista or Ethernet performance.
Availability is a separate variable. Avoiding a disruptive failure can preserve useful work even without improving nominal speed. But a model must avoid counting the same lost time once as lower availability and again as communication overhead. Define a consistent denominator of scheduled time and successful completed work.
Qualification and operations remain part of supply. Customers need a fabric that functions with their chosen software and equipment under sustained load. An open standard can lower barriers to interoperability; it cannot certify a complete deployment by itself. Production acceptance is stronger evidence than a product launch or standards announcement.
6. Financial Transmission
For a customer, the first financial bridge is accelerator time saved. If the same useful work finishes sooner, the operator can either process more work or use less capacity for the original requirement. The economic result depends on whether additional demand exists and whether the service can be monetized.
A planning model should compare the value of additional accepted work with incremental network capital cost, power, maintenance and operating complexity. It should also include deployment time. A solution with attractive steady-state performance can lose value if migration disrupts service or arrives after the customer’s demand window.
For the supplier, revenue depends on deployments won, equipment content and realized pricing. Profit depends on product mix, component costs, software and support economics, and the expense of serving complex customers. Large customer value does not establish a large supplier margin.
Competition can distribute gains toward buyers. Higher integration may reduce the number of components needed. Customer bargaining can capture a portion of the time savings through lower prices. Software and operational reliability can help a vendor retain value, but the effect must appear in repeat business and cash returns.
This is why supplier margins, bookings and customer economics must be read together. A high margin without durable demand is fragile. Rapid sales growth with weakening economics can make the supplier a conduit for investment rather than its lasting beneficiary.
7. Market Expectations
No date-stamped sell-side consensus growth series is treated as verified in this note. Management guidance provides an observable operating reference; the reverse valuation below tests explicit investor assumptions. The two are kept separate.
The bullish expectation would require networking to remain a high-value constraint as cluster architectures evolve, with the selected supplier retaining share and profitability. The cautious expectation would allow Ethernet spending to grow while competition, customer concentration or lower cost per unit of bandwidth limits per-share earnings growth.
The size of a broad AI semiconductor business does not settle the debate. Broadcom’s September release combines custom accelerator and networking activity within its AI semiconductor figures. Such disclosures cannot be used as a standalone Ethernet market series, nor added to downstream equipment revenue without considering supply-chain overlap. Broadcom fiscal Q3 results
The useful question is narrower: what level of future earnings requires additional execution from today’s price? That can be calculated without pretending to observe a single market consensus. A range of terminal multiples exposes the sensitivity instead of hiding it inside a target price.
8. What Is Already Priced In
Arista closed at $188.99 on 10 September. Annualizing the Q3 non-GAAP EPS guidance midpoint of $1.07 gives $4.28. The price is approximately 44.2 times that illustrative annualized earnings rate. It is not a verified next-twelve-month consensus multiple. Dated ANET price history
Consider a transparent reverse calculation. Assume an investor requires a 10% annual price return for three years and receives no dividend in the model. The required terminal price is $188.99 multiplied by 1.10 cubed, or $251.55. Divide that price by the assumed terminal earnings multiple to obtain required annual EPS.
At 30 times earnings, the terminal EPS requirement is about $8.38. At 35 times, it is $7.19. At 40 times, it is $6.29. Relative to the $4.28 starting run rate, those imply approximately 25.1%, 18.9% and 13.7% annual EPS growth over three years respectively.
All multiples, the horizon and the required return are analyst-selected assumptions. These are not price targets, probability-weighted forecasts or claims about consensus. They show how the operating hurdle changes if the valuation investors pay at exit is lower than the current run-rate ratio.
The model also exposes what revenue growth alone misses. EPS depends on margins, tax, share count and non-operating items. Sustaining a given EPS growth rate can become harder if margins normalize or dilution offsets part of operating progress. Buybacks require cash and should not be assumed free.
What is already visible in price is a material premium to current annualized earnings under this method. The company has already demonstrated substantial profitability. The additional investment case must explain the duration of future growth or a different valuation outcome, rather than re-presenting that profitability as a new discovery.
9. Potential Expectation Gap
The first potential gap is at the customer level. A market focused on link speed may underestimate the value of consistent job completion and operational reliability. If a fabric reduces expensive idle time across a large installed accelerator base, its economic contribution can exceed its share of the equipment budget.
That does not automatically become supplier upside. The second potential gap is between value created and value retained. Lower cost per unit of bandwidth, simplified topologies and stronger buyer bargaining can improve customer returns while limiting vendor revenue intensity.
Our working hypothesis is that workload evidence will become more discriminating than speed announcements. The attractive surprise would combine verified useful-work gains, repeat deployments and supplier earnings that clear the valuation hurdle. The disappointing surprise would be excellent technology with ordinary per-share economics.
An investor should therefore resist declaring a winner from an architecture label alone. Ethernet adoption, supplier share, customer benefit and equity returns are four separate propositions. Evidence for the first is not sufficient evidence for the fourth.
10. Bull / Base / Bear
Bull: customers validate substantial reductions in exposed communication time and disruption, expand deployments, and pay for an operating platform they find costly to replace. Profitable growth persists across product transitions. Upside surprise comes from earnings duration and cash conversion exceeding the investor’s explicit hurdle.
Base: deployment expands, but gains differ by workload. Faster products improve customer economics while some benefit passes through as lower cost per unit of bandwidth. Supplier growth continues with periodic mix and margin pressure. Returns depend heavily on the entry and exit multiple.
Bear: workloads are less communication-constrained than assumed, architectures reduce equipment intensity, or competitive offerings capture more spending. Qualification delays postpone revenue while operating expense rises. The equity can disappoint despite more aggregate AI network traffic.
These scenarios are analytical conditions rather than calibrated probabilities. The financial evidence is strong at the company level; publicly comparable production workload data is less complete. That asymmetry limits confidence in translating industry adoption directly into vendor earnings.
11. Invalidation
The thesis that networking is an important marginal constraint would weaken if comparable production workloads showed little exposed communication time and negligible economic benefit from fabric improvement. The comparison must hold software, workload quality and accelerator configuration sufficiently constant to isolate the mechanism.
The supplier-value hypothesis would fail if customers achieved those gains while the supplier consistently lost share, pricing or cash returns. A useful product can become more competitive and less profitable at the same time.
The valuation case would fail independently if plausible per-share earnings paths could not support the desired return under a defensible exit multiple. Investors should not extend the horizon or increase that multiple solely to preserve an attractive conclusion after operating evidence deteriorates.
12. Variables to Watch
Useful work: comparable job completion, service latency and successful output under a defined workload, rather than peak bandwidth alone.
Exposed communication: time not overlapped with computation, congestion behavior and dispersion across participants.
Fabric reliability: interruptions, recovery and accepted work lost, measured without double-counting downtime.
Commercial conversion: planned availability, qualification, accepted deployment and repeat orders as separate stages.
Supplier capture: share, equipment intensity, realized pricing, margins and cash generation after operating investment.
Per-share hurdle: EPS growth, dilution and valuation sensitivity against a dated entry price.
An industry estimate can help size a possible market, but it should be labeled as such and tested against these operating variables. No third-party market-size forecast is needed to establish the mechanism in this note.
13. Bottom Line
AI networking is valuable when it converts more installed accelerator time into useful, accepted work. The relevant performance metric is the customer’s completed workload under real constraints.
The investment test comes one step later: whether a supplier retains enough of that benefit, for long enough, to justify the price. Faster links begin the inquiry. They do not complete it.
Key sources: Arista Q2 2026 results; Arista 7060XE7 product announcement; UEC technical white paper; Broadcom fiscal Q3 2026 results; Stock Analysis dated ANET price history. Links appear at the relevant claims. Workload and valuation sensitivities are Sovereign Research analysis.
Related Research
Vertiv’s Time-to-Power Bet: From Strategic Fit to Cash Returns — The parallel time-to-power constraint, and who retains the value of earlier deployment.
September AI Infrastructure Scorecard: Demand, Constraints and Returns — Place networking alongside demand, physical constraints and returns across the stack.
Full Research
https://pavelsovereign.com/research/publications/ai-networking-the-economics-of-time/
Relevant Variables
Historical publication; original variable framework is preserved in the article.