SOVEREIGN RESEARCH · TERMINAL
Weekly Map: Delivery Improves, Return Proof Still Lags
By Pavel Sovereign ·
Historical author publication. Original date and analysis preserved; this is not a new Research OS judgment.
A weekly assessment of the bridge from physical delivery to useful compute and capital returns.
AI Infrastructure Weekly Map | Pavel Sovereign | Sovereign Research
AI Infrastructure Intelligence for Investors. Researching the capital cycle behind AI — from chips to power. Week reviewed: 5–11 September 2026. Information cutoff: 11 September; latest completed U.S. equity session: 10 September. This is a dated research snapshot, not a historical publication date.
1. Core Judgment
The evidence has moved from commitments toward reported physical delivery at one major operator. It has not yet established a sector-wide improvement in useful-compute efficiency or capital returns.
The change since our 9 September map is meaningful. We should no longer describe this week’s evidence solely as upstream demand and future power visibility. There is now a stronger operator-level conversion observation. Its scope must remain explicit: one operator’s reported capacity is not a measured utilization series for the whole AI infrastructure system.
Our model now separates three tests. Can compatible equipment reach an operational site? Can that equipment complete valuable work efficiently? Can the resulting cash flows compensate the capital providers? Evidence that passes the first test raises confidence in delivery without automatically passing the other two.
2. Variable Dashboard
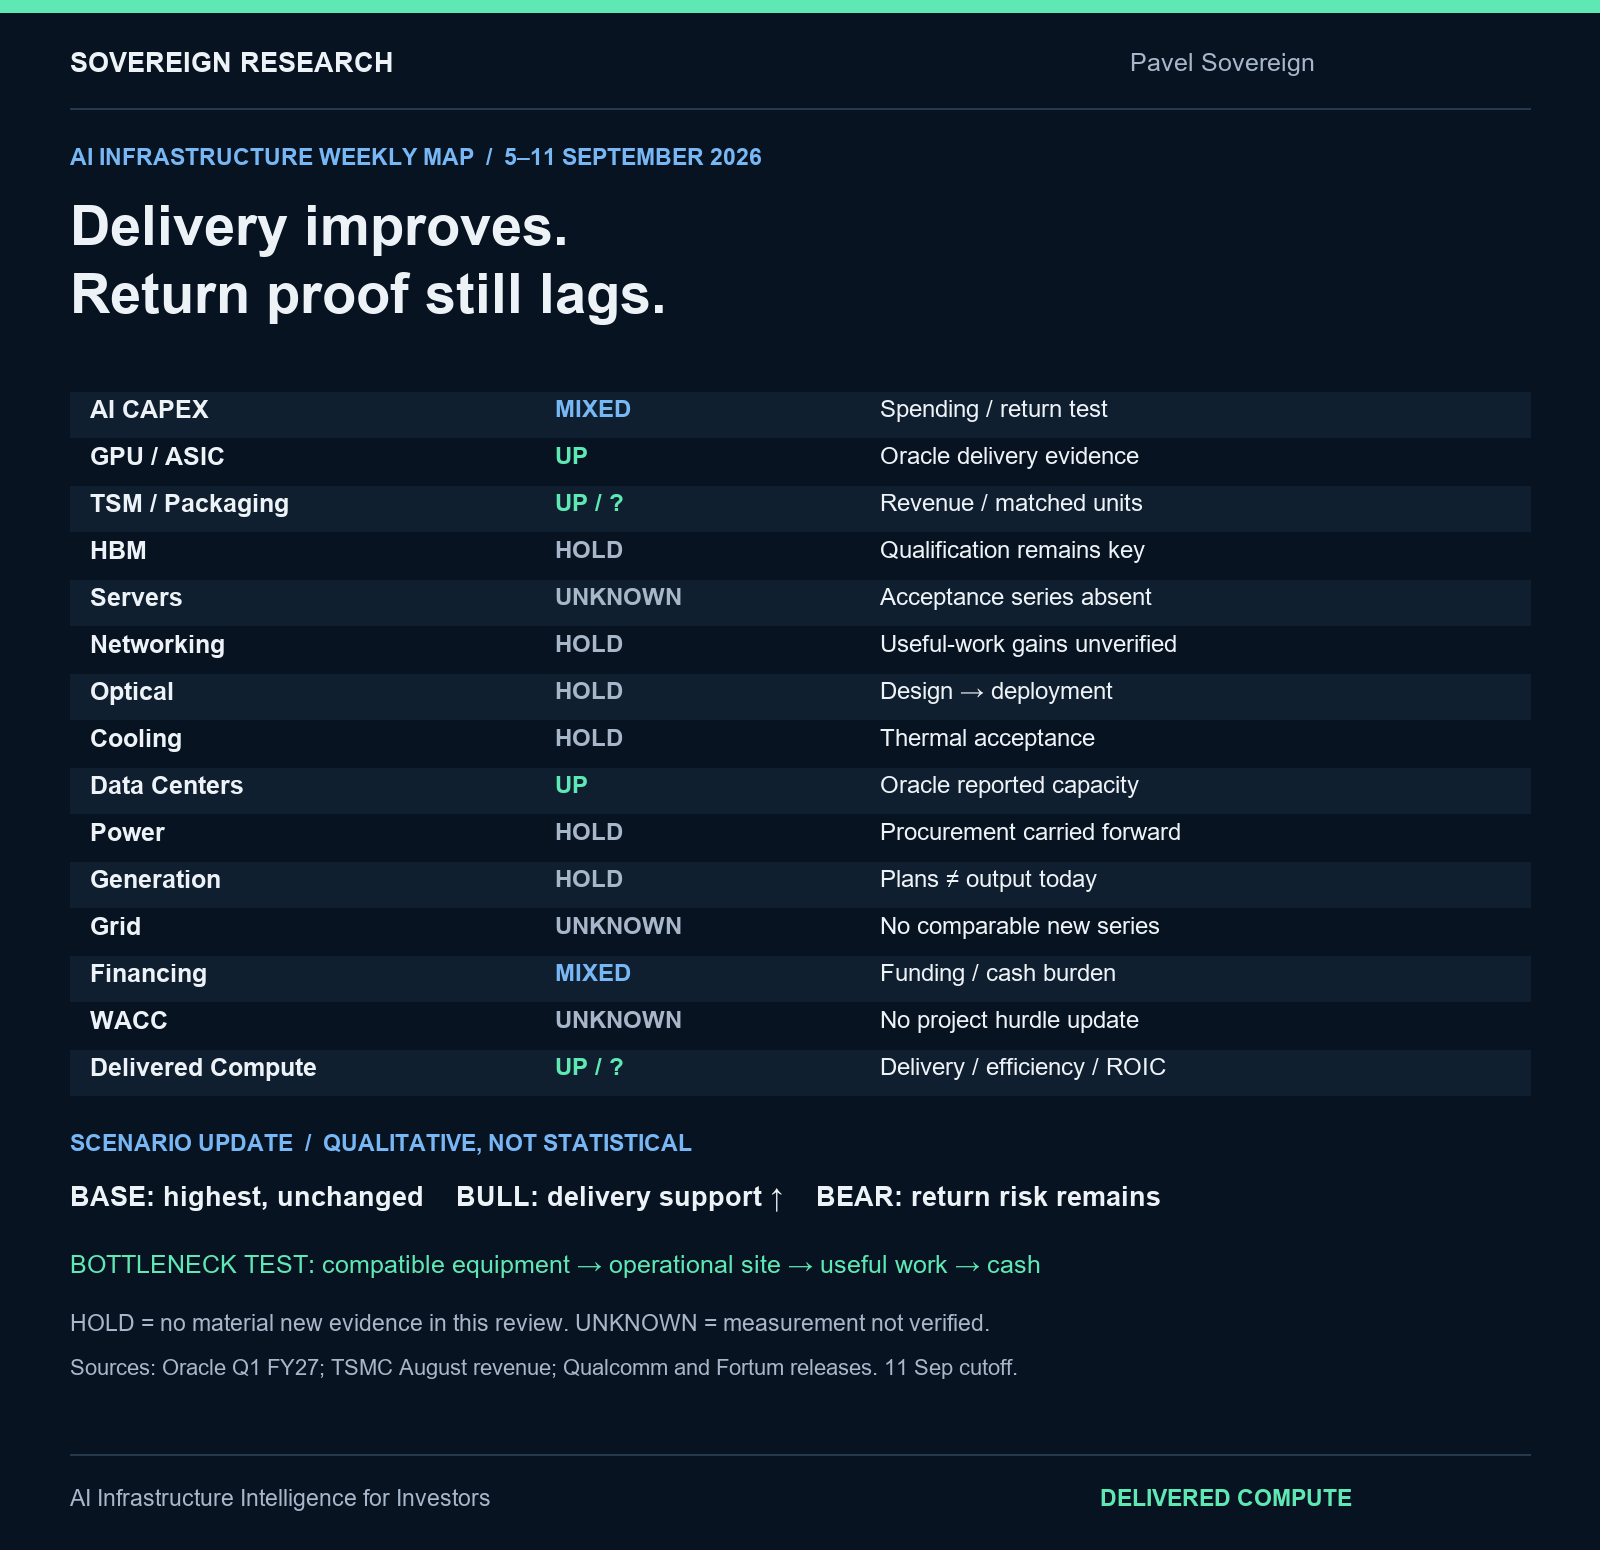
Legend: UP means new supportive evidence within the stated scope; MIXED means progress with an offsetting economic constraint; HOLD means the research judgment is carried forward without a material new observation; UNKNOWN means the required measurement was not verified. HOLD does not claim that the underlying industry was unchanged.
AI CAPEX
Update versus 9 September baseline: MIXED: new operator cash-investment evidence; no verified new sector aggregate
Delivered Compute implication: Capital is being deployed, but spending is not its own return
GPU / ASIC
Update versus 9 September baseline: UP: Oracle reports deliveries; Qualcomm architecture signal already incorporated
Delivered Compute implication: Stronger unit-conversion evidence, no standardized useful-work denominator
TSM / Packaging
Update versus 9 September baseline: UP for TSMC aggregate revenue; UNKNOWN for matched package output
Delivered Compute implication: More upstream activity does not identify the remaining package constraint
HBM
Update versus 9 September baseline: HOLD: product qualification remains the test; no new weekly matched-supply series
Delivered Compute implication: Do not convert capacity announcements into accepted accelerator sets
Servers
Update versus 9 September baseline: UNKNOWN: no independently comparable acceptance series verified
Delivered Compute implication: Delivery and acceptance remain distinct milestones
Networking
Update versus 9 September baseline: HOLD: workload efficiency remains unmeasured at sector level
Delivered Compute implication: Link-speed roadmaps cannot establish job-time improvement
Optical
Update versus 9 September baseline: HOLD: Qualcomm collaboration carried forward
Delivered Compute implication: Design intent still needs qualified commercial deployment
Cooling
Update versus 9 September baseline: HOLD: no new comparable thermal-acceptance observation
Delivered Compute implication: Higher rack density still requires a functioning cooling system
Data Centers
Update versus 9 September baseline: UP: Oracle reports additional capacity
Delivered Compute implication: Physical conversion evidence improves at a named operator
Power
Update versus 9 September baseline: HOLD: Finland procurement visibility already incorporated
Delivered Compute implication: Contracted power does not establish every site’s usable MW
Generation
Update versus 9 September baseline: HOLD: life-extension and uprate plans carried forward
Delivered Compute implication: Preserved supply and future additions are separate from output today
Grid
Update versus 9 September baseline: UNKNOWN: no new comparable queue or energization series verified
Delivered Compute implication: No basis for declaring system-wide interconnection relief
Financing
Update versus 9 September baseline: MIXED: Oracle reports completed equity funding and negative free cash flow
Delivered Compute implication: Capital access supports buildout; dilution and cash burden remain relevant
WACC
Update versus 9 September baseline: UNKNOWN: no matched issuer/project cost-of-capital update calculated
Delivered Compute implication: Do not assume a lower hurdle rate from improved capital access
Delivered Compute
Update versus 9 September baseline: UP for delivery evidence; UNKNOWN for workload-normalized output and ROIC
Delivered Compute implication: Upgrade the conversion observation, retain the efficiency and return tests
This dashboard combines new facts with explicit carry-forwards. It does not pretend that every layer produces a reliable weekly data point.
3. What Changed This Week
New since the prior map: Oracle’s 10 September release reports 850MW of additional data-center capacity, more than 300,000 GPUs delivered since the end of Q4, and Q1 cloud infrastructure revenue of $7.4 billion, up 121% year over year. It also reports $23 billion of operating cash flow, negative $5 billion of free cash flow and completion of a $20 billion common-stock issuance program before commissions. These are company-reported figures, not independently measured productive capacity. Oracle Q1 FY2027 results
Variable change: confidence in physical conversion at Oracle rises. Transmission: completed infrastructure can support revenue, while funding and reinvestment determine what remains for capital providers. Limit: the disclosed aggregates do not support a cohort-matched calculation of revenue per newly delivered MW, GPU utilization or AI project ROIC. Dividing the quarter’s total revenue by its capacity addition would produce a misleading ratio.
TSMC’s 10 September report puts August revenue at NT$514.81 billion, up 10.1% month over month and 53.3% year over year. This is aggregate company revenue in local currency. It is not a CoWoS unit count or a qualification-yield disclosure. TSMC August revenue
Variable change: upstream revenue momentum gains another observation. Transmission: stronger upstream activity can support equipment supply, but the accelerator-specific matching constraint remains unresolved. Limit: product mix and revenue cannot identify which package configurations became easier to obtain.
Already incorporated, not counted twice: the 8 September Qualcomm–Amazon collaboration covers custom silicon and optical connectivity; it remains an architecture and design signal. The 9 September Fortum–Google agreement improves long-term power economics. Fortum identifies life extension and uprates, including an expected additional 10MW increase alongside an already planned 38MW uprate. These are distinct from a newly operating nuclear plant. Qualcomm announcement, Fortum release
4. Structural Shift
The model is becoming more specific about the conversion losses between capital and revenue. The first new Deep Dive examines whether logic, HBM and packaging form compatible accepted sets. The second examines whether a functioning network reduces exposed communication time sufficiently to improve useful work.
Those mechanisms connect upstream supply with downstream power. A completed accelerator cannot create revenue while waiting for a site. An energized site cannot deliver the intended service while waiting for qualified equipment. A fully installed cluster can still underperform if communication, availability or software prevents efficient work.
The structural shift is therefore from tracking the largest announced input to identifying the limiting conversion at each site and workload. This is our analytical inference. It is not a claim that the whole industry’s binding constraint changed on a single date.
For a fixed cohort, follow capital committed, equipment accepted, capacity operational, useful work delivered and cash recovered. Keep the cohort and measurement period consistent. Sector aggregates that mix different stages are useful context but poor substitutes for this bridge.
5. Market Expectations
The two Deep Dives impose different valuation tests. Memory’s apparently low multiple of an annualized strong quarter is sensitive to earnings normalization. Networking’s premium to its current annualized earnings reference requires sustained growth or a supportive exit valuation. These are explicit sensitivities, not a newly verified consensus forecast.
This week’s operator delivery evidence strengthens the infrastructure thesis, but a stock’s response depends on what investors already expected. A larger buildout can improve revenue while also increasing financing needs. A faster network can improve customer economics while competition transfers part of that benefit away from the supplier.
No post-release Oracle stock-return claim is made here. Its release came after the 10 September U.S. close, and the 11 September session is outside the price cutoff. Using the prior closing price as though it incorporated the release would confuse the order of events.
6. Key Expectation Gaps
Delivery versus utilization: the market could correctly identify more installed capacity while overstating how quickly it becomes productive. The missing evidence is accepted workload output under a comparable service requirement.
Capacity versus compatibility: broad semiconductor growth can coexist with shortages in the particular configurations a deployment needs. The missing evidence is matched, qualified output rather than an aggregate expansion headline.
Customer value versus supplier capture: efficiency can improve without a proportional increase in network equipment spending or margins. The missing evidence is the commercial split of the benefit.
Funding versus returns: access to equity or debt supports construction but does not establish that the completed asset earns its cost of capital. The missing evidence is cohort cash recovery after operating costs, maintenance, expansion and financing.
None of these gaps is automatically a trade. Each identifies a proposition that can diverge from operating reality and a measurement that would resolve the disagreement.
7. Probability Updates
The previous map used qualitative scenario rankings. We retain that basis instead of inventing prior numerical probabilities.
Base: uneven conversion, selective returns
Prior ranking: Highest
Current update: Remains highest; confidence in physical conversion rises
Evidence needed for a larger revision: Repeated delivery across operators, matched with productive output and cash recovery
Bull: faster conversion with durable economics
Prior ranking: Secondary
Current update: Modestly more plausible on delivery; not promoted above base
Evidence needed for a larger revision: Useful-work efficiency and returns improve alongside deployment, without disproportionate funding costs
Bear: capital outruns productive demand or funding capacity
Prior ranking: Secondary
Current update: Pure non-delivery concern eases at Oracle; return and financing risks remain
Evidence needed for a larger revision: Repeated acceptance delays, weak utilization, adverse funding or poor cash recovery would raise the case
These are editorial judgments, not statistical probabilities. The change is asymmetric: an actual delivery observation challenges a pure delay thesis more directly than it validates long-run shareholder returns. That is why the base case remains dominant even after a favorable update.
The framework would become more bullish if several operators demonstrated both repeated delivery and improving unit economics. It would become more bearish if growing physical capacity coincided with weaker accepted demand or persistently inadequate cash returns.
8. What to Watch Next
Follow the next operator disclosures for consistent definitions of delivered, energized, accepted and utilized capacity. Seek cohort timing rather than dividing unrelated quarterly aggregates. Reconcile revenue progress with cash investment and funding claims.
At the equipment layer, separate qualification milestones from samples and roadmaps. For HBM and packaging, test whether the right inputs arrive together. For networking and optical, look for production workload results and subsequent commercial adoption.
At the physical layer, track project-specific energization, cooling acceptance and the realized timing of power additions. Procurement visibility can improve months or years before the intended site operates.
What did not materially change in this research model: HBM matching, network workload efficiency, cooling readiness and optical commercial conversion remain carry-forward judgments. No new sector-wide server acceptance, grid relief, WACC or useful-compute efficiency series was verified. Those are evidence limitations, not assertions that nothing happened.
9. Bottom Line
This week strengthens the case that capital is becoming physical capacity at a major operator. It also sharpens the distinction between completing the build and earning the return.
Keep the full chain intact: compatible equipment, an operational site, useful work and cash recovery. Delivered Compute remains the research object because it forces those links to be tested together.
Key sources: Oracle Q1 FY2027 results; TSMC August 2026 revenue; Qualcomm–Amazon collaboration; Fortum–Google agreement. Prior baseline: Sovereign Research’s 9 September Weekly Map and September Scorecard. The scenario updates and causal framework are Sovereign Research analysis.
Full Research
https://pavelsovereign.com/research/publications/weekly-map-delivery-improves-return/
Relevant Variables
Historical publication; original variable framework is preserved in the article.